Symtrain · UX Design · 2025
Performance Dashboards
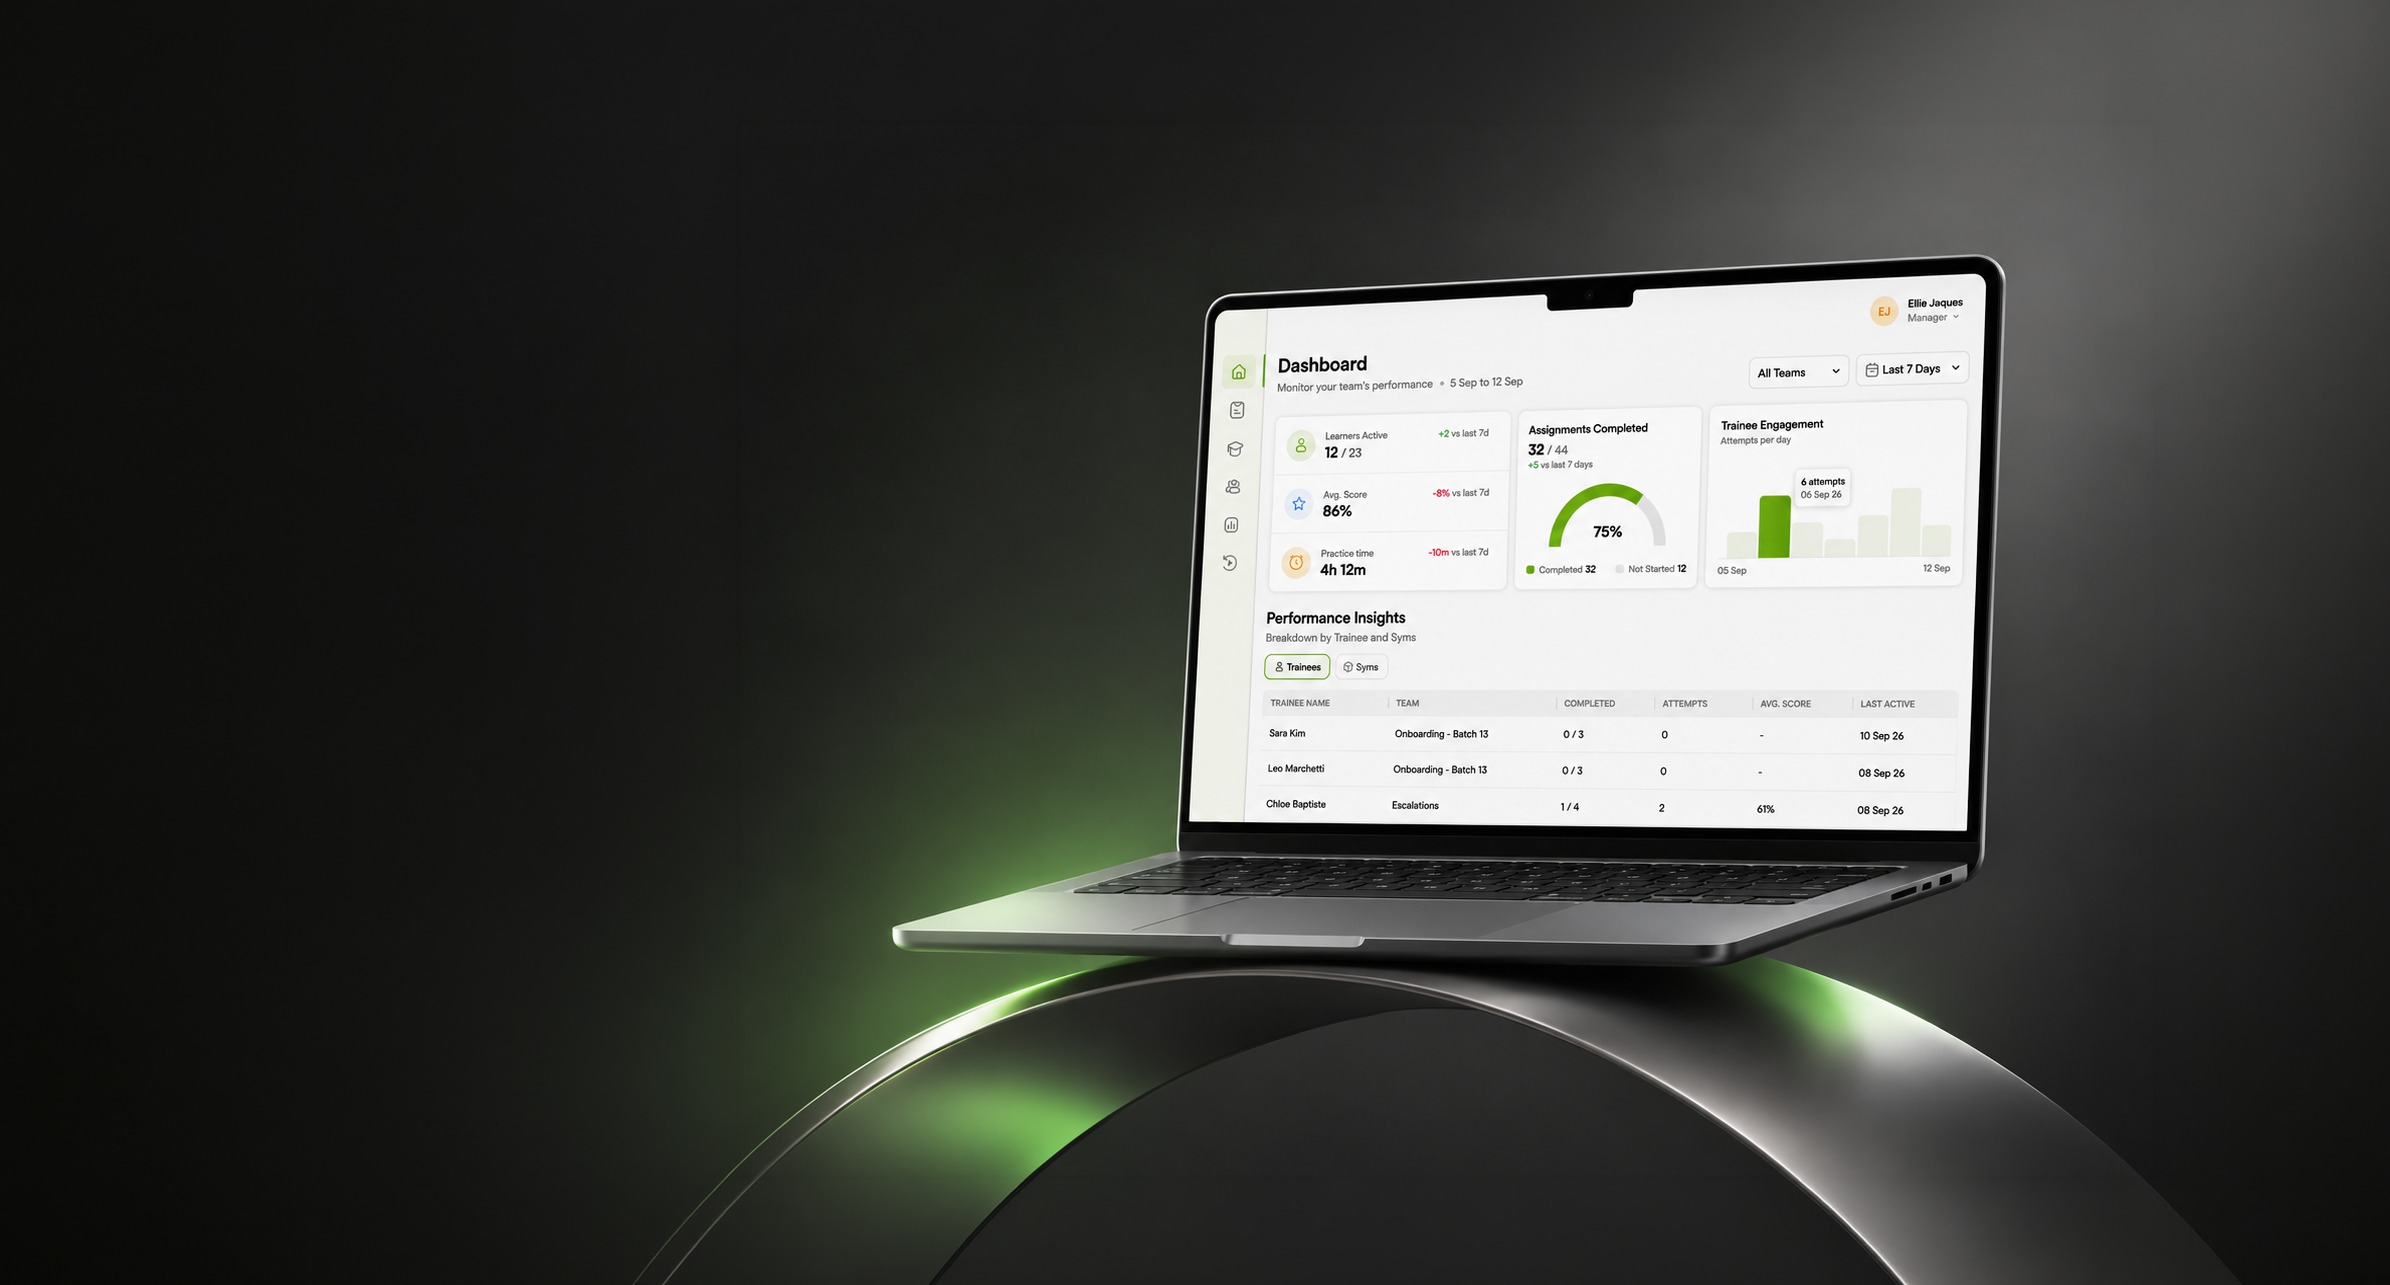
Two connected surfaces in Symtrain's management layer: a daily read of team health, and a drill down from the whole org to a single trainee.
Symtrain is where customer facing teams practise real calls as simulations, or Syms. Once training is assigned and taken, the harder product question begins: is it working, and where is it not. These two dashboards are the answer, the surfaces a manager uses after the training, to understand performance and act on it.
They are one project because they are one job at two depths. The Manager Dashboard is the daily read of team health. The Teams Performance Dashboard is the deep investigation, from the organization down to a single person. I designed both end to end, and shipped them: what each surfaces, how the data is ranked and navigated, and how understanding turns into an action.
The management layer, after the training and before the intervention.
The simulations are where trainees practise. These dashboards are what comes next: the place managers read whether practice is turning into performance, and decide where to spend their attention. Two of the stops in that layer were this project.
One monitors. The other investigates.
The two are designed to hand off. A manager lives in the first for the everyday read, and crosses into the second when a number asks a harder question. Keeping them distinct is what keeps each one simple.
- An operational overview, read in seconds
- Learner activity, scores, practice, completion
- Two lenses: trainees and the Syms themselves
- The everyday question: is my team on track
- A deeper performance investigation
- Organization, team and individual depths
- Comparisons, drill downs and priorities
- The harder question: who needs me, and what next
Both face the same problem: turning performance data into a decision.
Training produces a constant stream of signals, participation, scores, completion, engagement, across people, teams and simulations. The design work in both dashboards is the same at heart: make that volume understandable, navigable, and attached to an action, so a manager is never just staring at numbers.
Understandable at a glance
Rank the signals, do not just show them. The most urgent read sits highest, the detail waits below for when a number needs explaining.
Navigable with depth
A manager should move from a summary to a specific team, Sym or person without losing the thread, and without relearning the screen each time.
Priorities that surface themselves
At risk, overdue and ready states come forward on their own, so problems find the manager rather than the other way around.
Attached to an action
Every important finding carries its next step, coach, nudge, assign, report, so analysis ends in a verb, not a shrug.
The health of a team was scattered across reports.
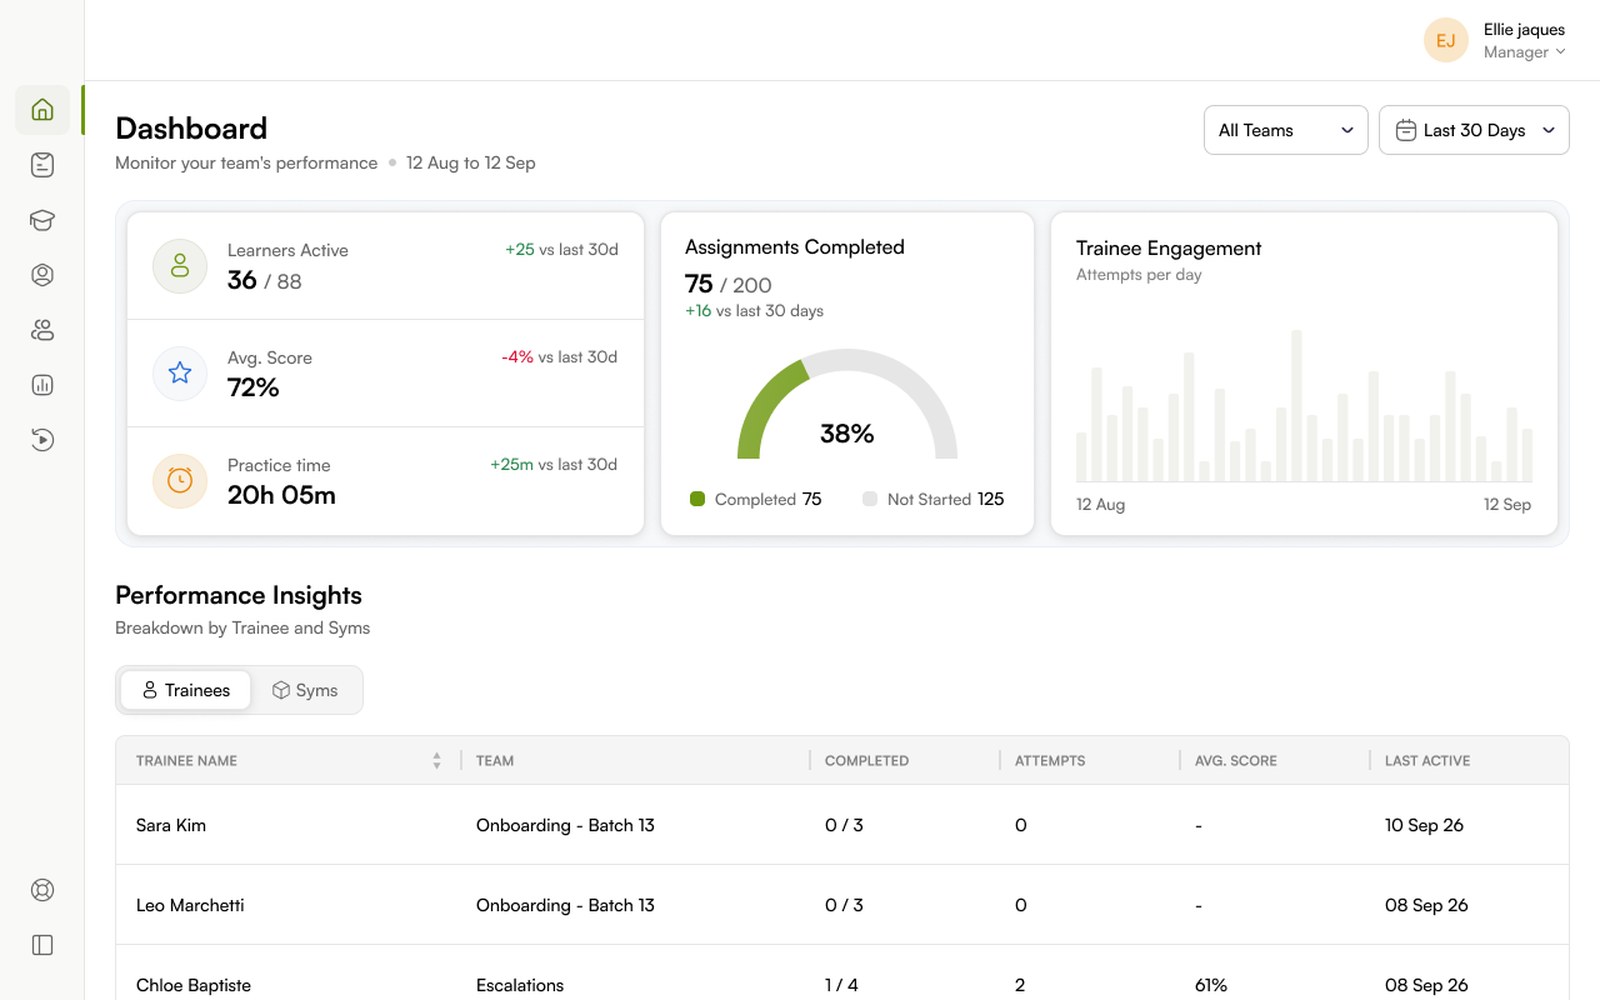
Participation, scores, time spent, assignment progress and engagement each lived in a different place. The Manager Dashboard consolidates them into a single screen, layered by how urgently a manager needs each one.
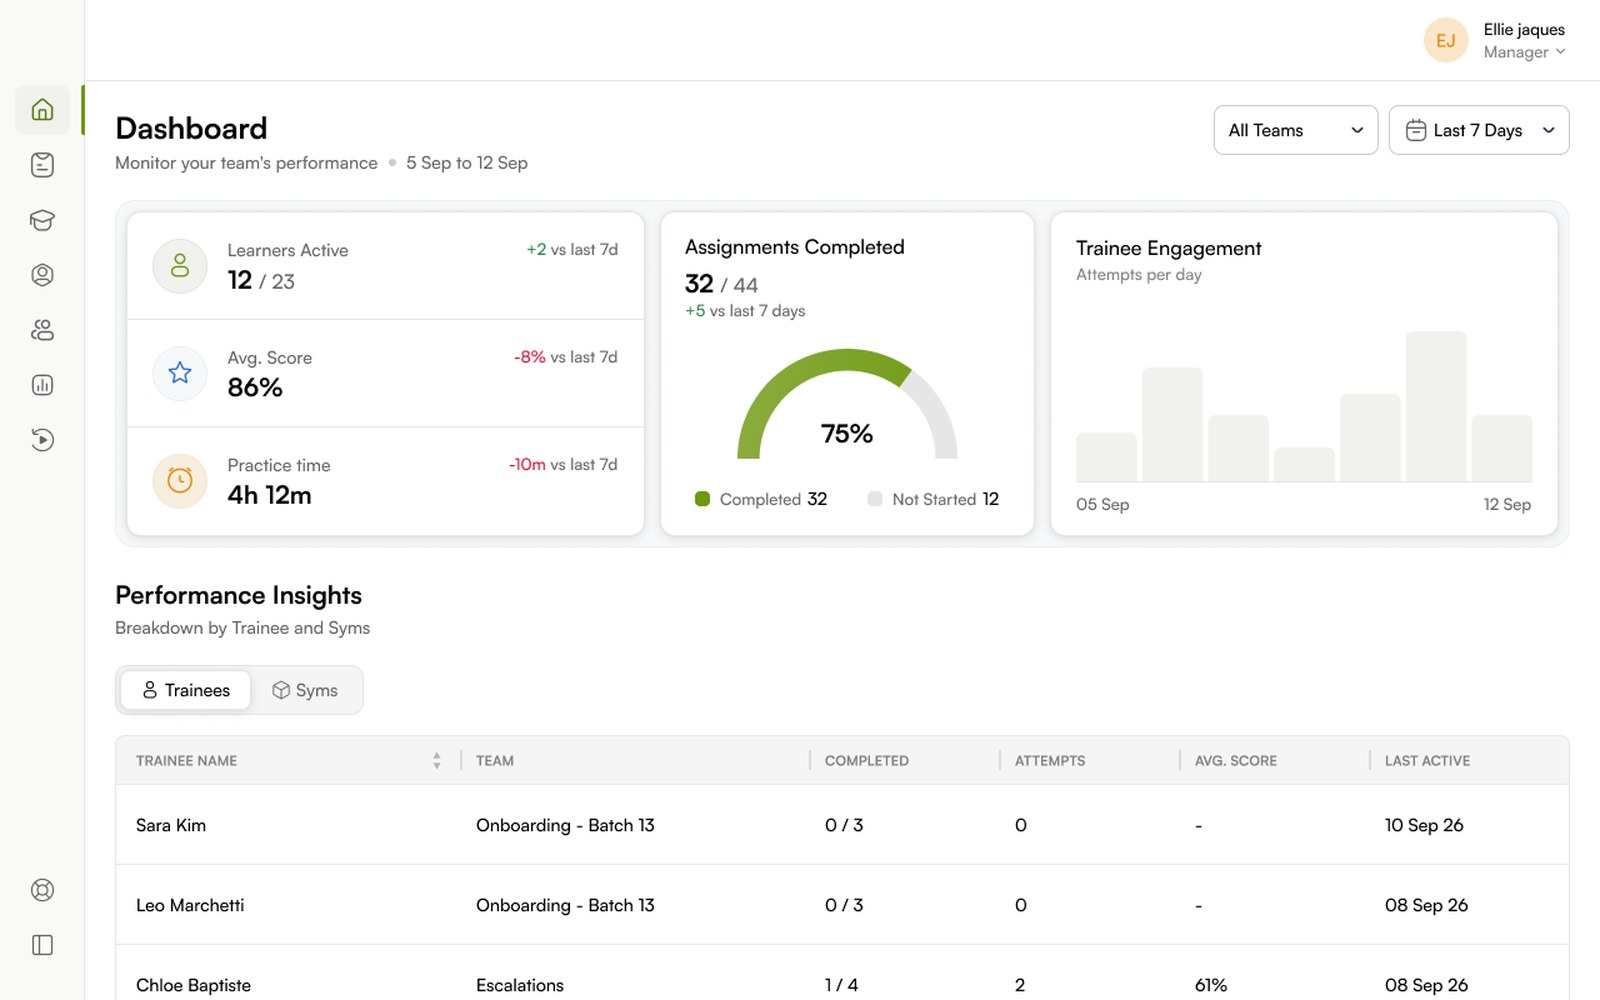
Each number is a question, answered in the way it reads best.
The form follows the question. A rate becomes a gauge, a pattern becomes a trend, a comparison becomes a table.
KPIs as a headline, with a direction
Each KPI pairs a large current value with a change against the previous period, green for up, red for down. A manager reads the number and its direction in one look, the difference between knowing the score and knowing whether it is improving.
A gauge for completion, a bar for engagement
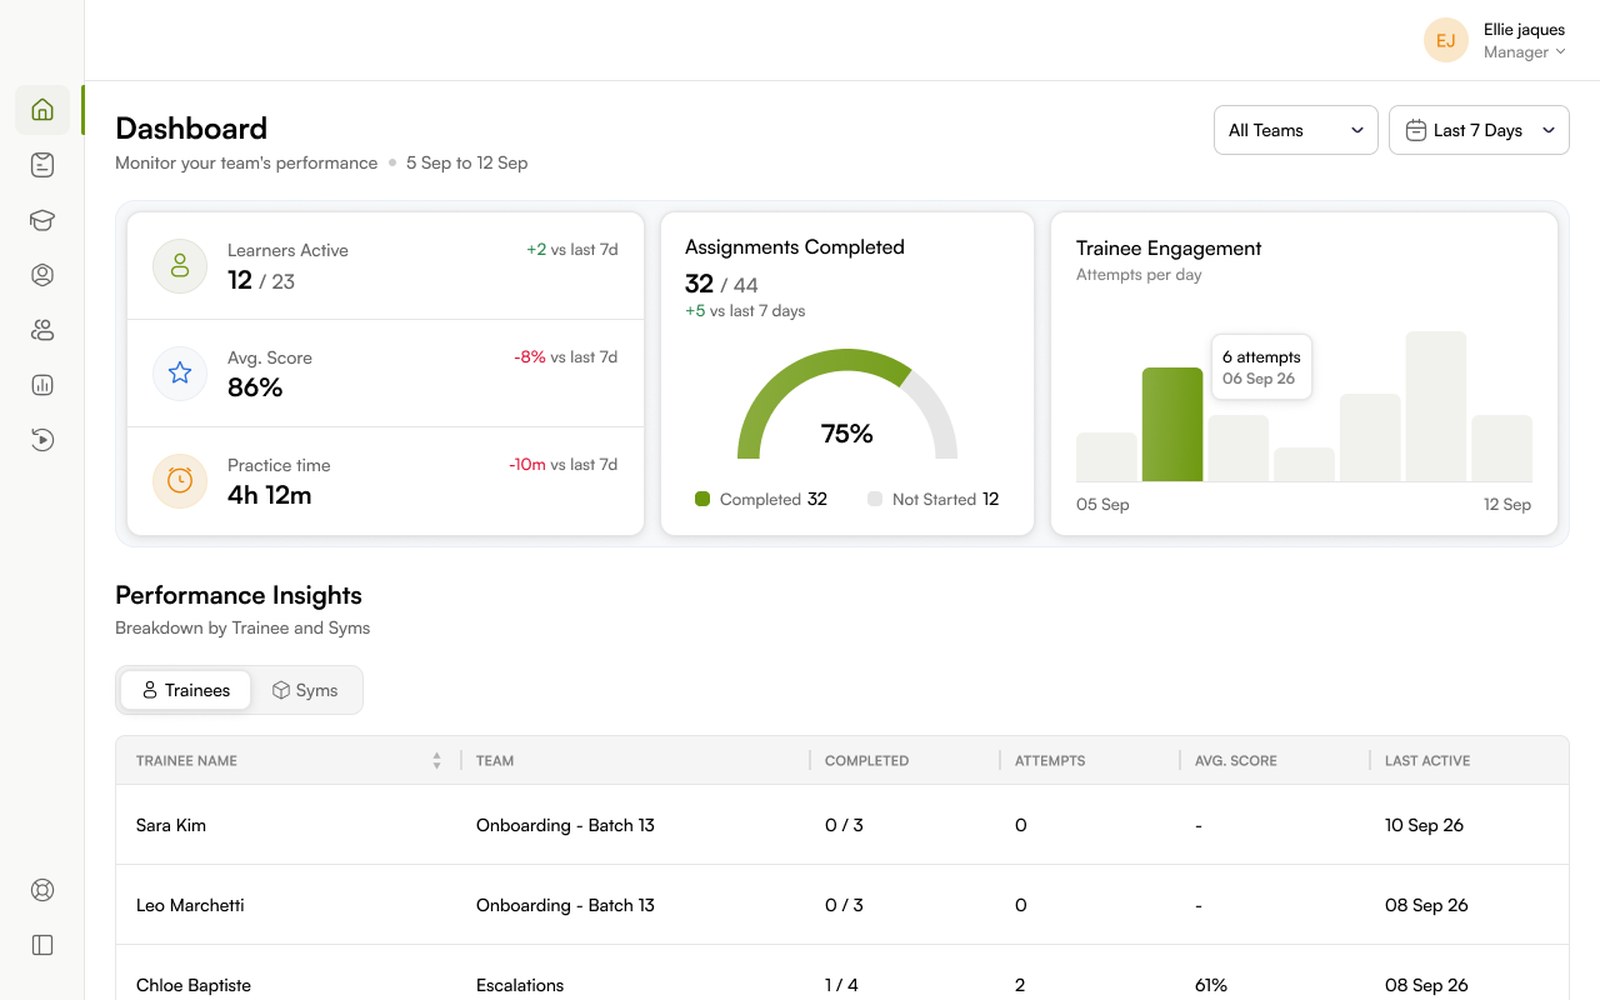
Completion is a part to whole fact, so it is a gauge, completed against not started. Engagement is a pattern over time, so it is a bar chart of attempts per day, where a hover reveals the exact count for a date.
Performance Insights, read from two directions
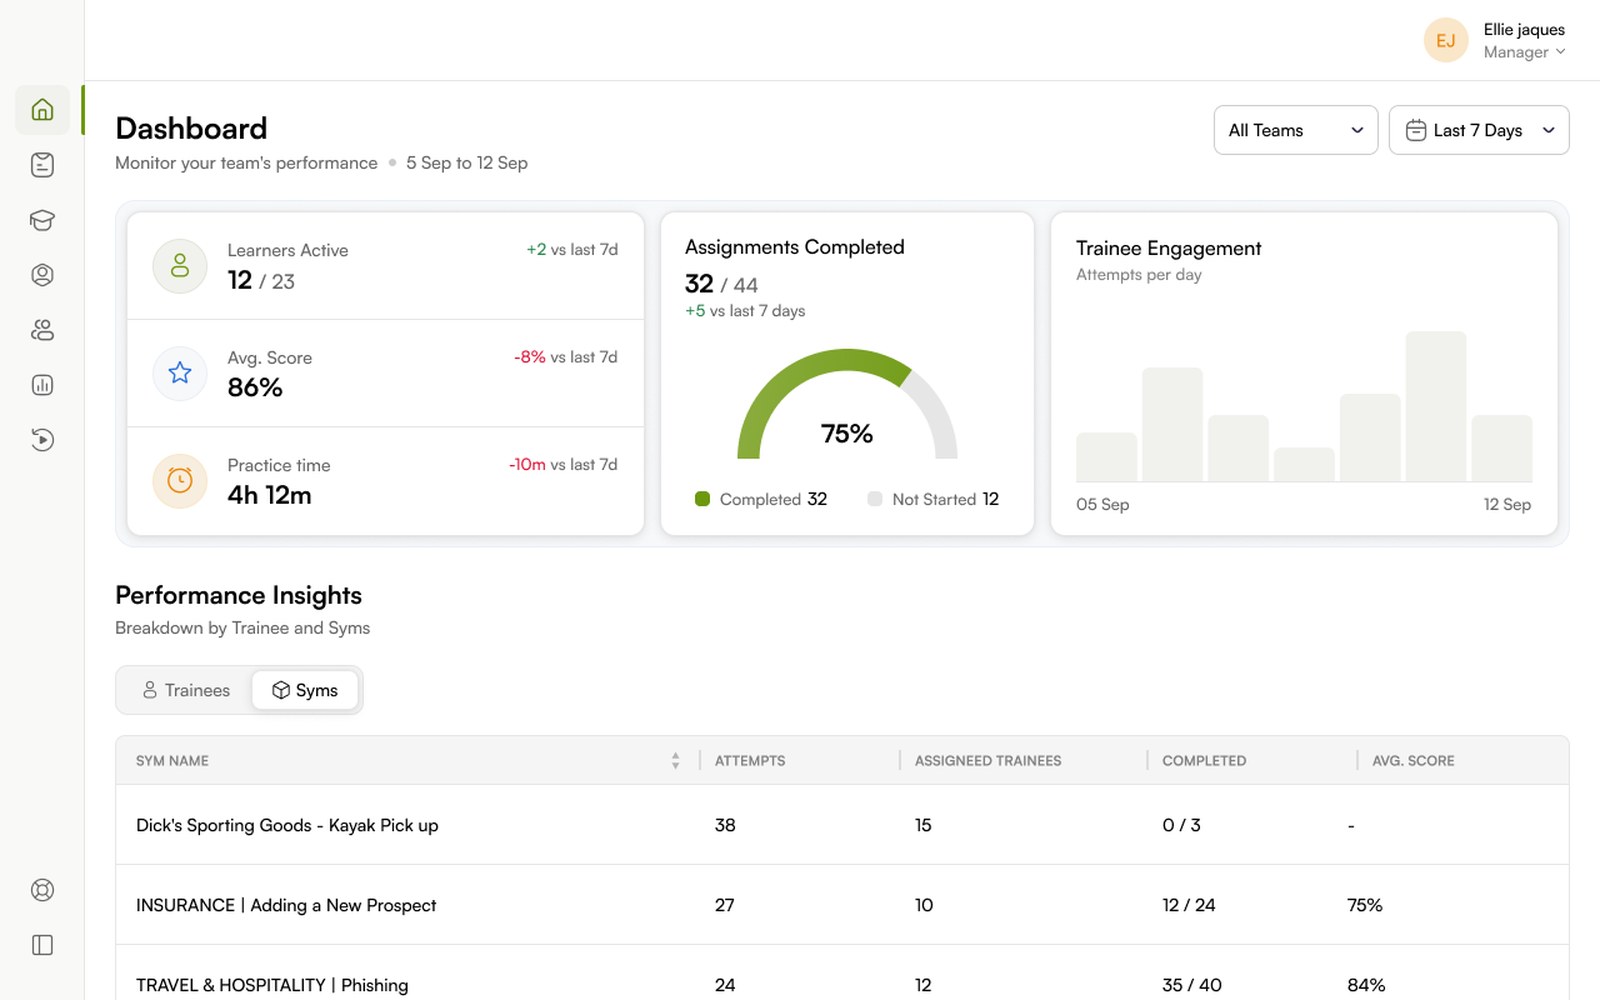
The same section answers two questions. The Trainees view ranks people by completion, attempts, score and last active, so a manager spots who is falling behind. The Syms view flips the lens to the simulations, attempts, assigned trainees, completion and score, so a manager spots which exercise is underperforming.
One investigation, three depths.
Where the Manager Dashboard gives the read, this gives the investigation. It is a single drill down: a manager starts at the organization, selects a team such as Team Apollo, then opens an individual such as Evander Whitmore. The data narrows at each step, the way it is read does not.
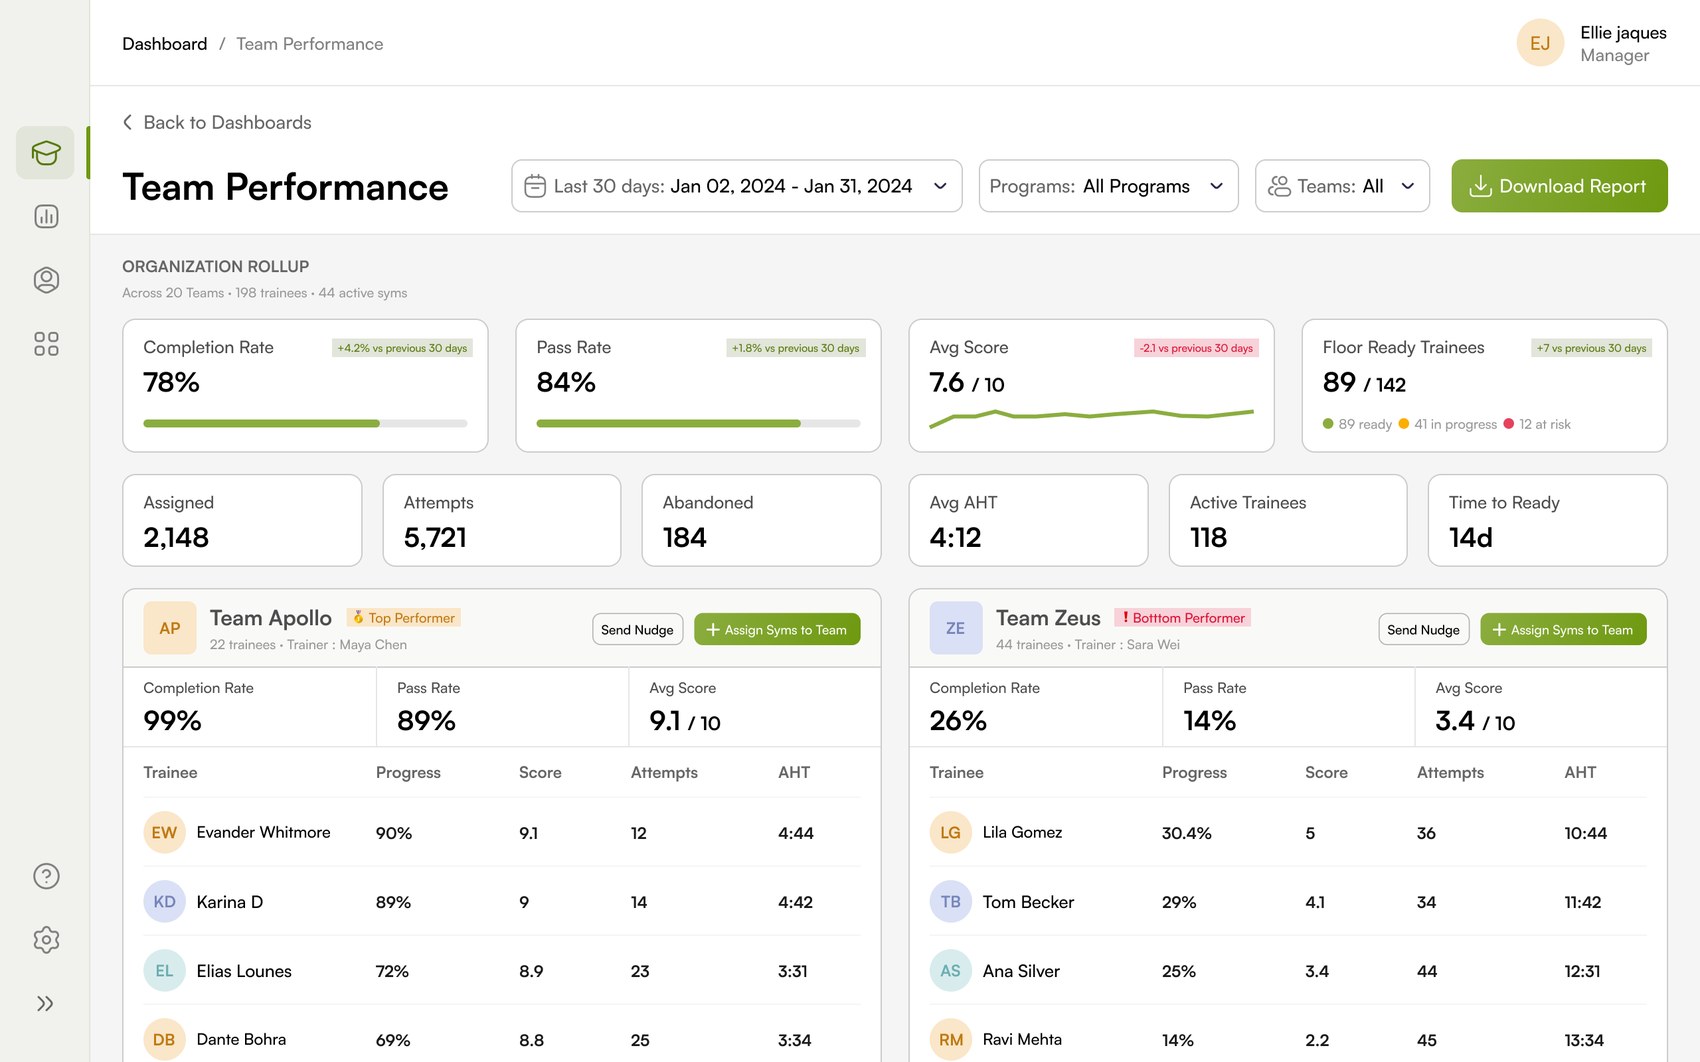
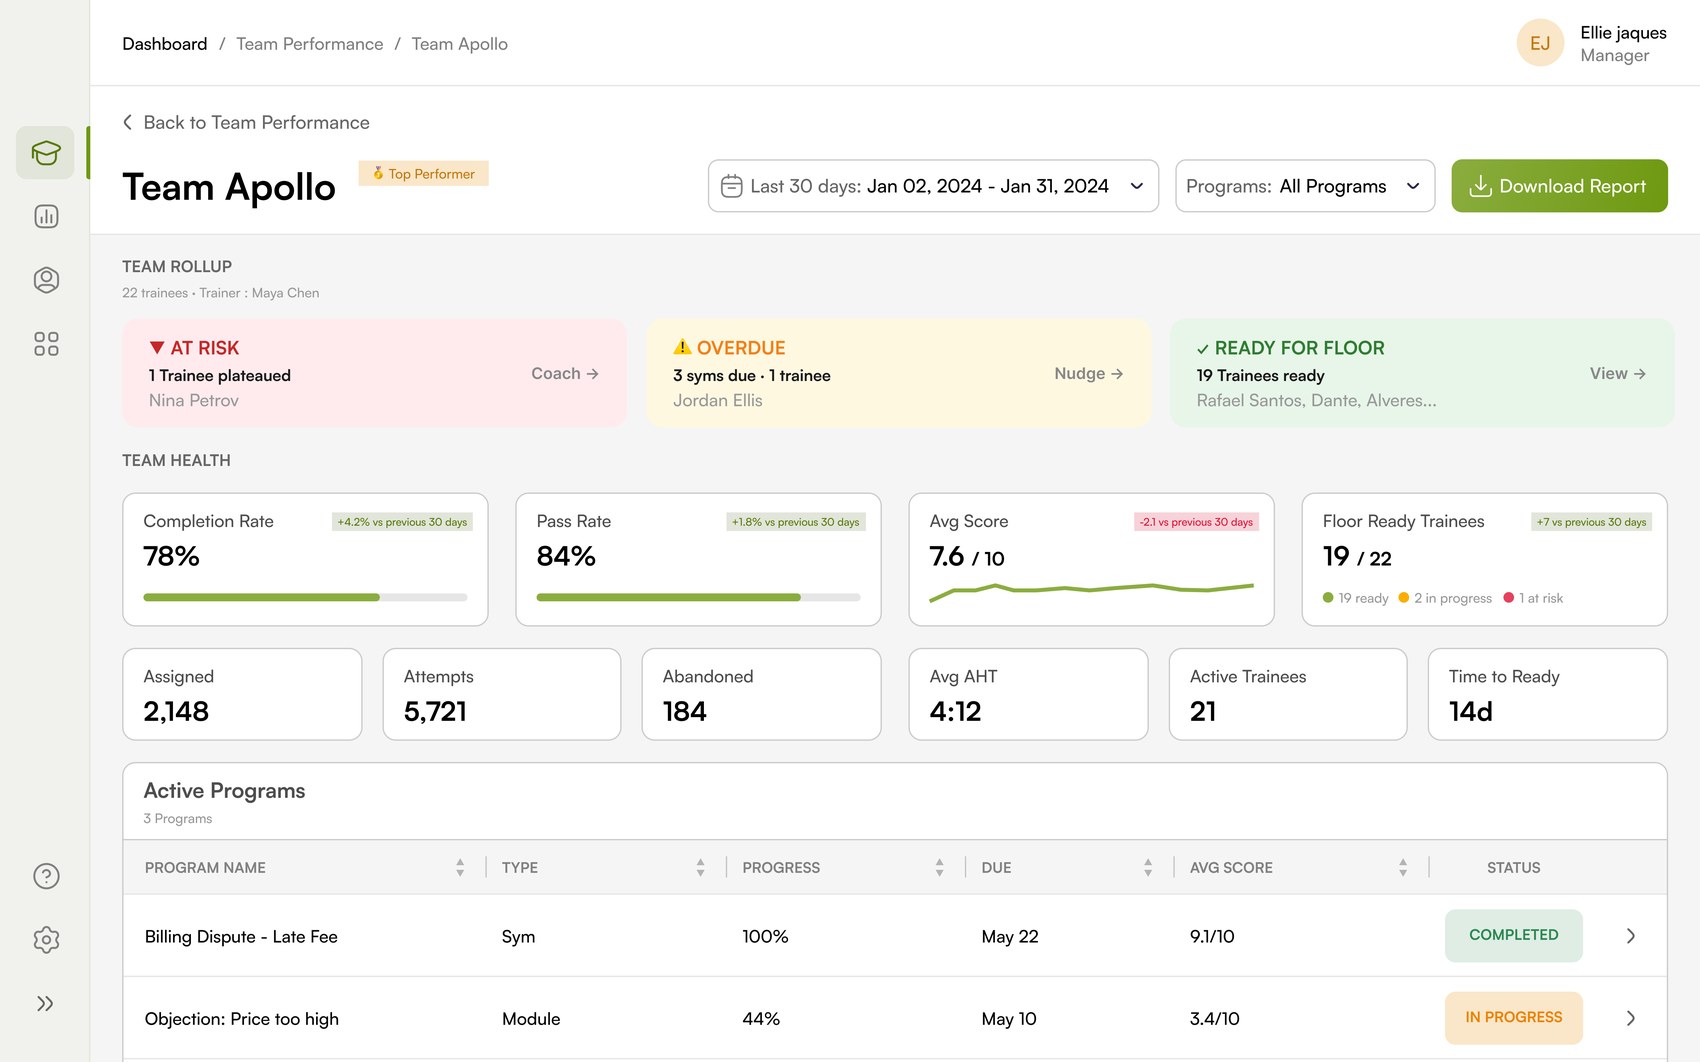
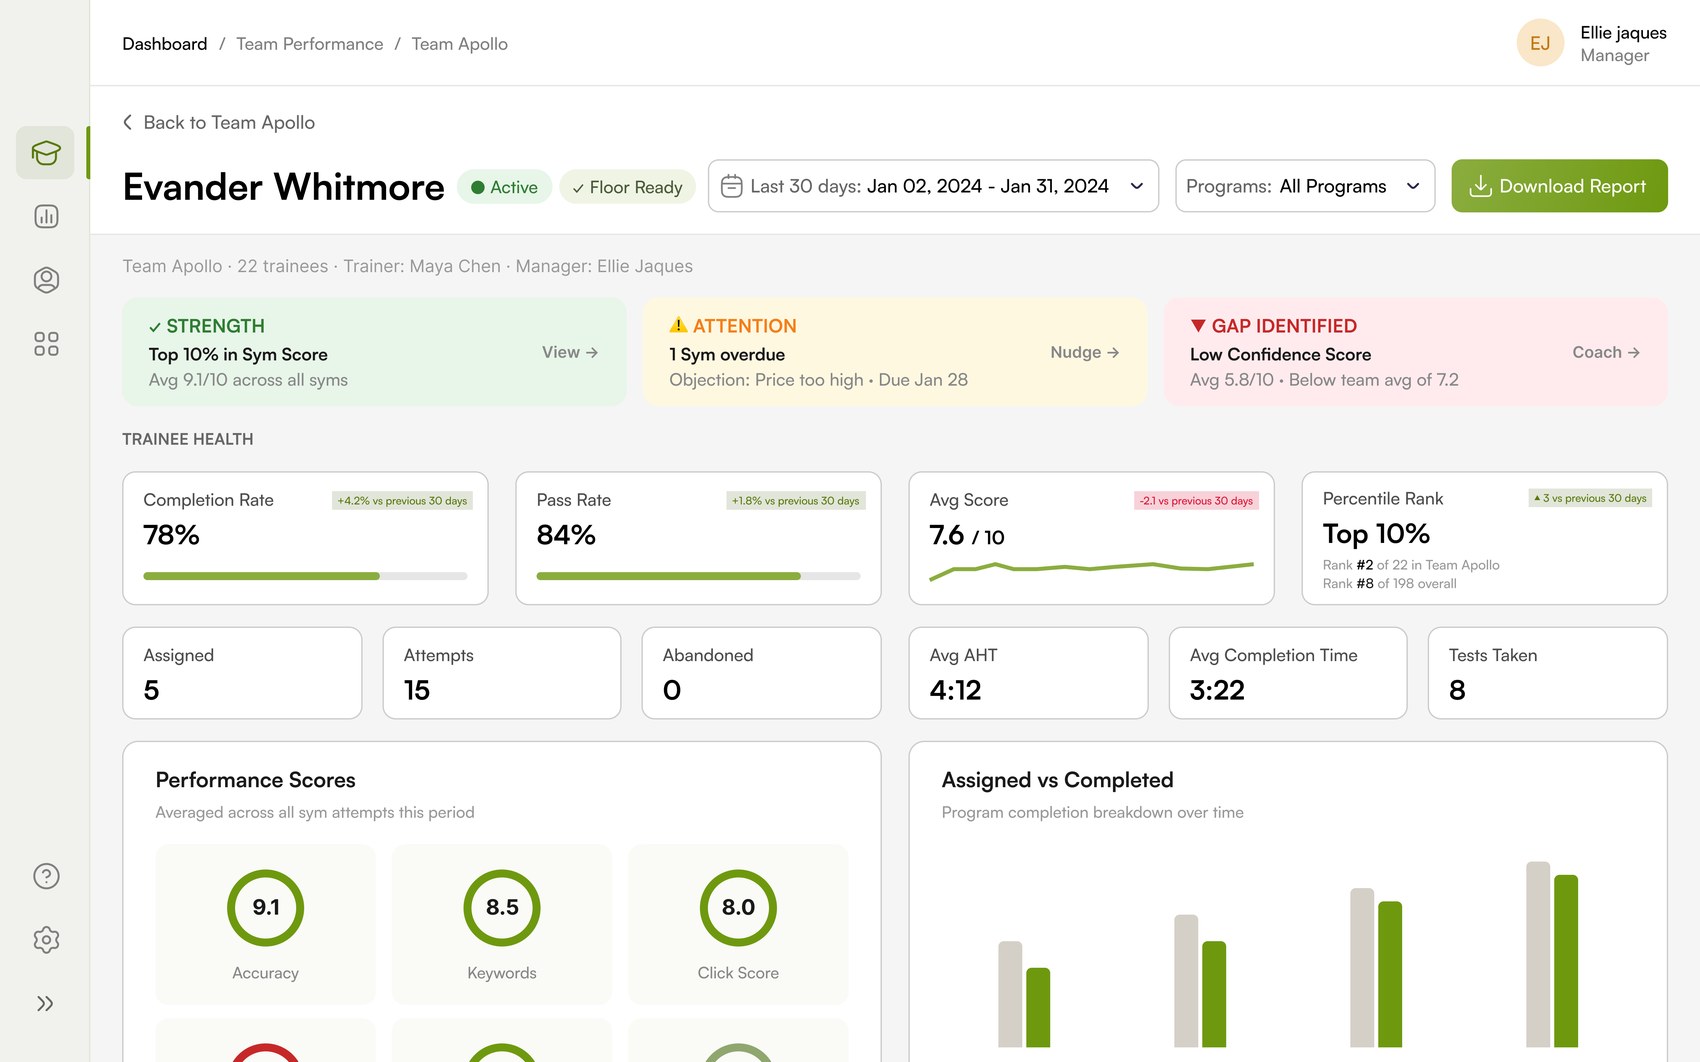
What holds the drill down together is a repeated scaffolding. Every level, from org to individual, is built from the same four parts in the same order, so a manager learns to read the screen once and reads it the same way three levels deep.
Start with the whole org, teams ranked by how they are doing.
The rollup reads the organization in one view: headline health, activity at scale, and a ranked list of teams where the top and bottom performers are called out, so the first question, which teams need me, is already answered.
Open a team, and the priorities come to you first.
Team Apollo leads with a triage band, not a table. Before any metric, the screen names who is at risk, what is overdue and who is ready for the floor, and pairs each with the action it implies.
Priorities before metrics
A manager should not read six charts to learn that one trainee has plateaued. The triage band states it plainly and offers Coach, Nudge or View, so the screen moves from insight to action in a single step.
Programs tied to performance
Active Programs connects the training work to the result: each program's type, progress, due date, average score and status, so a manager sees not just how a team performs, but how its training is moving.
Open a person, and the data becomes a coaching conversation.
Evander Whitmore keeps the exact shape of the team view, one level down. The same band now reads as strength, attention and gap, and the detail turns into the granular scores a manager can actually coach against.
One score becomes three
An average hides where a person is strong or weak. Splitting it into Accuracy, Keywords and Click Score turns a grade into a diagnosis, and tells a coach exactly what to work on.
Workload against completion
Assigned versus Completed over time shows the relationship a single completion rate cannot: whether a person is behind because they are overloaded, or because they have stopped.
Every level answers the same question, asked more precisely.
Across both, analytics that end in a verb.
The two dashboards share a grammar. A finding is never a dead end, it carries its next step. And a consistent colour tells the manager what matters before they read a word of it.
A plateaued trainee carries Coach. An overdue Sym carries Nudge. A ready cohort carries View. A whole team carries Assign Syms and Send Nudge. Any screen can produce a Download Report. Understanding and acting live in the same place.
One colour grammar, used the same way in a daily overview and three levels into an investigation, so priority is recognised, not read.
Two surfaces, one way of thinking.
Designing both meant working across the management layer at once: the glance and the investigation, held to the same principles so they feel like one product. Rank what matters, let priorities surface, repeat the structure so it is learned once, and attach every finding to an action.
The quiet discipline in data heavy design is restraint, deciding what a manager needs first, what can wait, and what belongs a level deeper. That is what lets one screen be read in seconds and another be investigated three levels down, without either feeling heavy. It is the part of enterprise analytics that does not show up in a screenshot, and it is where this project lived.